
Chicago Traffic Accidents & Crashes
Any time you venture out onto the Chicago streets, there’s a chance you’ll get into an accident.
Whether you’re the driver or the passenger, a collision with a vehicle, cyclist, pedestrian, or some stationary object is always a statistical possibility. It’s a risk we learn to accept as the price of admission to the modern world, but a risk all the same. After all, on a nation-wide scale, the National Highway Traffic Safety Administration (NHTSA) reports1 more than 17,000 accidents per day on average.
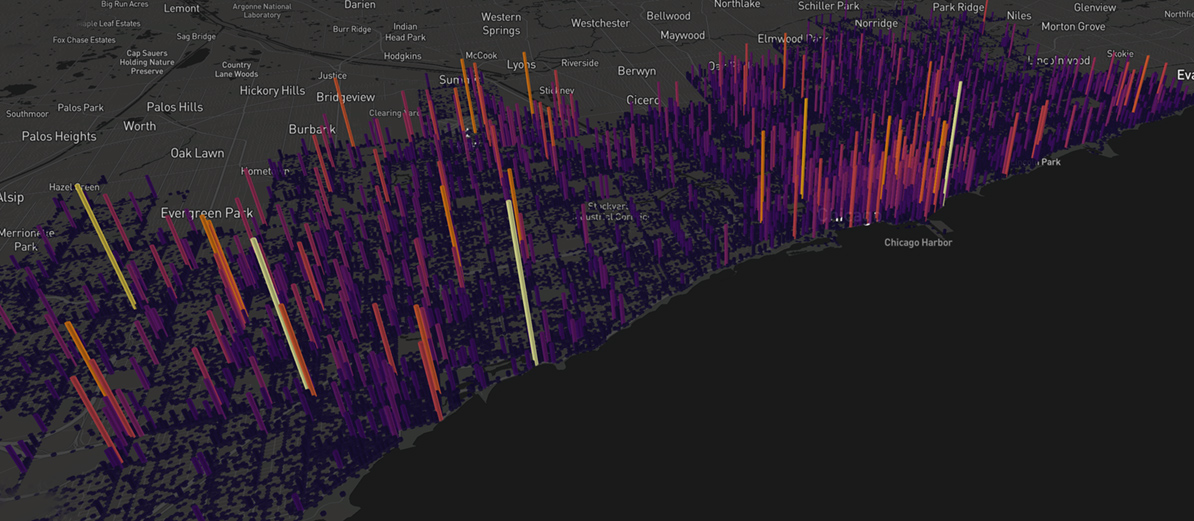
But most of us drive to and from work every day without ever (or only very rarely) experiencing even a minor fender bender. So just how dangerous are the roads we travel and what factors are at play when motor vehicle collisions are concerned? To learn more, we took a look at data made available from the City of Chicago2 and built this interactive heat map to better display the data. Here, you can review motor vehicle collision data from 2015 through March 2019, zoom in or out, and toggle between a 2D or 3D display.
Below, you’ll find some of our observations, analysis, and interpretations of the hefty data set we delved into relating to auto collisions in The Windy City. You will find some of these conclusions focus on various locals, while others convey more general, city-wide trends.
One of the top questions on our minds was which Chicago intersections are the biggest hot spots for collisions.
Topping off our list, the area with the the most collisions over the period of data collection is Lake Shore Drive & E 57th Drive. In the city's South Side near the Museum of Science and Industry, this Hyde Park intersection places a stop light on Lake Shore Drive itself, generating a stop in traffic that some expressway drivers may not be expecting.
| Rank | Intersection | Reported Collisions 2015 - March 2019 |
|---|---|---|
| 1 | Lake Shore Drive & E 57th Drive (Southbound On-Ramp) | 200 |
| 2 | S Stony Island Ave & E 79th Street | 178 |
| 3 | S Stony Island Ave & E 95th Street | 159 |
| 4 | S Cicero Ave & W 76th Street | 149 |
| 5 | S Cicero Ave & W 57th Street |
146 |
| 6 | S Halsted Street & W 95th Street |
113 |
| 7 | S State Street & E 63rd Street |
111 |
| 8 | W 87th Street & S LaSalle Street |
110 |
| 9 | N Lake Shore Drive & E Oak Street |
105 |
| 10 | S Stewart Ave & W 84th Street |
104 |
* Most Dangerous Intersections & Areas by Number of Collisions Reported Within a 10 Meter Radius
As you can see below, this intersection offers enough space for drivers to move fast, and feel safe behind the wheel. But as we've seen in the data, this intersection is not as safe as it seems.
Lake Shore Drive & E 57th Drive
Another question on our minds was which Chicago intersections had the most injuries.
Fender benders are one thing, but where in the city are people actually sustaining injuries after a collision? As you’ll see below, the intersections with the most reported injuries correspond exactly with the intersections that have the most reported collisions. But consider that of the 200 reported accidents at Lake Shore Drive & E 57th Drive, 50 resulted in injuries, and of the 178 reported accidents at S Stony Island Ave & E 79th Street, 46 resulted in injuries.
That means, according to our data, that 25.0% of the accidents at Lake Shore Drive & 57th result in injuries, but 25.8% of accidents at Stony Island Ave & 79th St result in injuries. This makes accidents occurring at Stony Island and 79th (listed at number two on both tables) slightly but measurably more likely to result in an accident.
| Rank | Intersection | Reported Injuries 2015 - March 2019 |
|---|---|---|
| 1 | Lake Shore Drive & E 57th Drive (Southbound On-Ramp) | 50 |
| 2 | S Stony Island Ave & E 79th Street | 46 |
| 3 | S Stony Island Ave & E 95th Street | 37 |
| 4 | S Cicero Ave & W 76th Street | 35 |
| 5 | S Cicero Ave & W 57th Street |
33 |
| 6 | S Halsted Street & W 95th Street |
27 |
| 7 | S State Street & E 63rd Street |
26 |
| 8 | W 87th Street & S LaSalle Street |
26 |
| 9 | N Lake Shore Drive & E Oak Street |
25 |
| 10 | S Stewart Ave & W 84th Street |
23 |
* Most Dangerous Intersections & Areas by Number of Injuries Reported Within a 10 Meter Radius
The second biggest hot spot for both vehicle collisions and vehicle injuries is one of Chicago’s famous six-way intersections, South Stony Island Ave and East 79th St (seen below). Adding to the confusion inherent in a six-way crossing, this intersection is also partially obstructed by the beams of the nearby Chicago Skyway Toll Road.
S Stony Island Ave & E 79th St
However, the issue may not only be the six-way intersection and visibility alone, but also Stony Island Avenue itself. It’s worth noting that the third biggest hot spot for accidents is also along Stony Island Ave, only two miles south where it intersects with E 95th St.
Traffic Collisions by Police District & Community Area
Another way to look at this data is to consider broader localities of the city and their collision dynamics. In the following table you will see which police districts have the highest occurrence of traffic accidents and the corresponding neighborhoods (or "Community Areas" to use the official parlance of the CPD reports) of each district.
| Police District | Community Areas (approximate) | Bicycle-Auto Collisions, 2015 - March 2019 | Pedestrian-Auto Collisions, 2015 - March 2019 | All Collisions (Including Auto-Auto), 2015 - March 2019 | |||
| Total | per 10K Population | Total | per 10K Population | Total | per 10K Population | ||
| 1st | Loop, Near South Side | 268 | 46.97 | 501 | 87.81 | 19995 | 3504.51 |
| 2nd | Hyde Park, Washington Park, Kenwood, Grand BLVD, Oakland, Douglas | 59 | 5.37 | 236 | 21.46 | 8930 | 812.08 |
| 3rd | South Shore, Woodlawn, Greater Grand Crossing | 82 | 10.90 | 279 | 37.08 | 11326 | 1505.42 |
| 4th | Avalon Park, South Chicago, Burnside, Calumet Heights, South Deering, East Side, Hegewisch | 31 | 2.51 | 152 | 12.30 | 9830 | 795.47 |
| 5th | Roseland, Pullman, West Pullman, Riverdale | 29 | 3.90 | 109 | 14.65 | 5835 | 784.32 |
| 6th | Auburn Gresham, Chatham | 53 | 5.83 | 304 | 33.47 | 11791 | 1297.98 |
| 7th | Englewood, West Englewood | 79 | 11.12 | 259 | 36.44 | 7972 | 1121.7 |
| 8th | West Lawn, Ashburn, Chicago Lawn, West Elsdon, Archer Heights, Garfield Ridge, Clearing | 166 | 6.71 | 422 | 17.06 | 24340 | 983.94 |
| 9th | Bridgeport, McKinley Park, New City, Gage Park, Brighton Park, Fuller Park | 150 | 9.64 | 281 | 18.05 | 12683 | 814.68 |
| 10th | North Lawndale, South Lawndale, Lower West Side | 92 | 7.79 | 256 | 21.68 | 9950 | 842.56 |
| 11th | Humbolt Park, West Garfield Park, East Garfield Park | 122 | 17.31 | 356 | 50.52 | 11302 | 1603.71 |
| 12th | Near West Side, West Town | 450 | 35.19 | 419 | 32.77 | 18713 | 1463.45 |
| 14th | Logan Square | 374 | 31.77 | 263 | 22.34 | 10766 | 914.4 |
| 15th | Austin | 56 | 9.42 | 207 | 34.81 | 8178 | 1375.42 |
| 16th | Portage Park, Jefferson Park, Forest Glenn, Dunning, Norwood Park, Edison Park, O'Hare | 127 | 6.37 | 213 | 10.68 | 15136 | 758.77 |
| 17th | Albany Park, Irving Park, Avondale, North Park | 225 | 15.61 | 262 | 18.18 | 11864 | 823.34 |
| 18th | Lincoln Park, Near North Side | 429 | 36.65 | 515 | 44.00 | 19289 | 1648.05 |
| 19th | Lake View, Uptown, North Center | 439 | 21.86 | 420 | 20.92 | 13854 | 689.99 |
| 20th | Lincoln Square, Edgewater | 155 | 16.98 | 160 | 17.53 | 7364 | 806.76 |
| 22nd | Beverly, Washington Heights, Mount Greenwood, Morgan Park | 52 | 5.10 | 138 | 13.54 | 9390 | 921.12 |
| 24th | Rogers Park, West Ridge | 145 | 10.28 | 207 | 14.68 | 10432 | 739.66 |
| 25th | Montclare, Belmont Cragin | 219 | 10.93 | 308 | 15.37 | 16132 | 805.03 |
So how do cyclists fare on the mean streets of Chicago?
With more than 10,000 bike racks across the city and over 200 miles of on-street, protected and buffered bike lanes,3 The Windy City is widely considered to be one of the best metro areas in the nation for bicycle commuters. And while bicycles and motor vehicles have long tried to coexist peacefully in Chicago, it can’t be ignored that collisions involving bicycles do happen. For the relatively unprotected cyclist, these can be incredibly dangerous.
One of the most common accidents cyclists face on the road is what is known as a “dooring.” This is when a moving bicycle violently meets an open vehicle door. Typically this happens when a curb-parked vehicle opens its door just inches in front of a zooming cyclist in the bike lane, resulting in a crash. Even though Chicago is considered a great city for cyclists, incidents of doorings have been sharply increasing since 20154
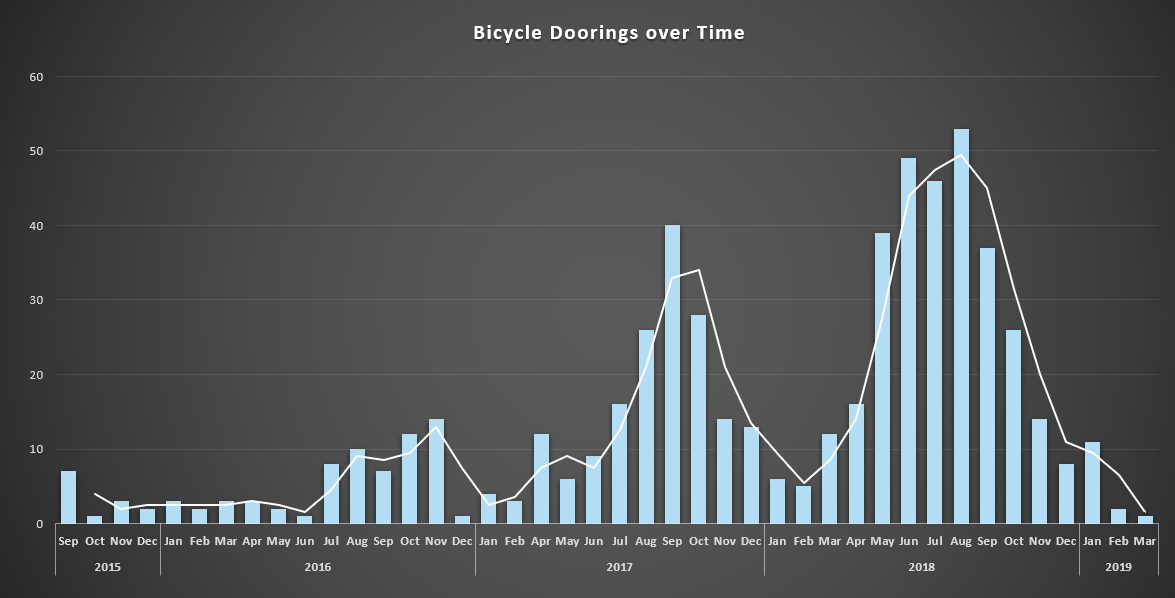
One possible explanation for the increase in doorings could be that the city has also seen a rise in bicycle commuters over the past few years, a reaction to the recent investments in biking infrastructure. Another potential cause is the popularity of relatively new ride sharing services, which have increased the regularity of quick, curb-side vehicle entries and exits. Predictably, doorings tend to spike in the better weather we experience in the summertime, and fall during the less bike-friendly winters. The chart above depicts this readily apparent seasonal trend while also showing the magnitude of overall growth. The white line shows the average of the previous 2 month period.
Chicago is also a walking city.
According to the US Census5, 6.7% of Chicago’s workforce walks to work, compare that to just 2.7% of Americans in general. And when you consider that of the 28.2% of residents who take public transit to work, many of them likely combine busses or trains with a short walk, as well as the fact that residents and visitors alike tend to walk from place to place for pleasure, it becomes clear why Chicago’s streets and sidewalks are alive with pedestrians.
So where are cyclists and pedestrians getting hit? Seeing as we have a number of walkers and bikers in our Chicago office, we became curious where most of the pedestrian and bicycle related collisions occur. The results read like a Who’s Who of Chicago’s most popular shopping and dining areas with Lincoln Park topping the list along with West Town, Lakeview, The Loop, and Logan Square.
The full list, with separations for cyclists and pedestrians, is included below.
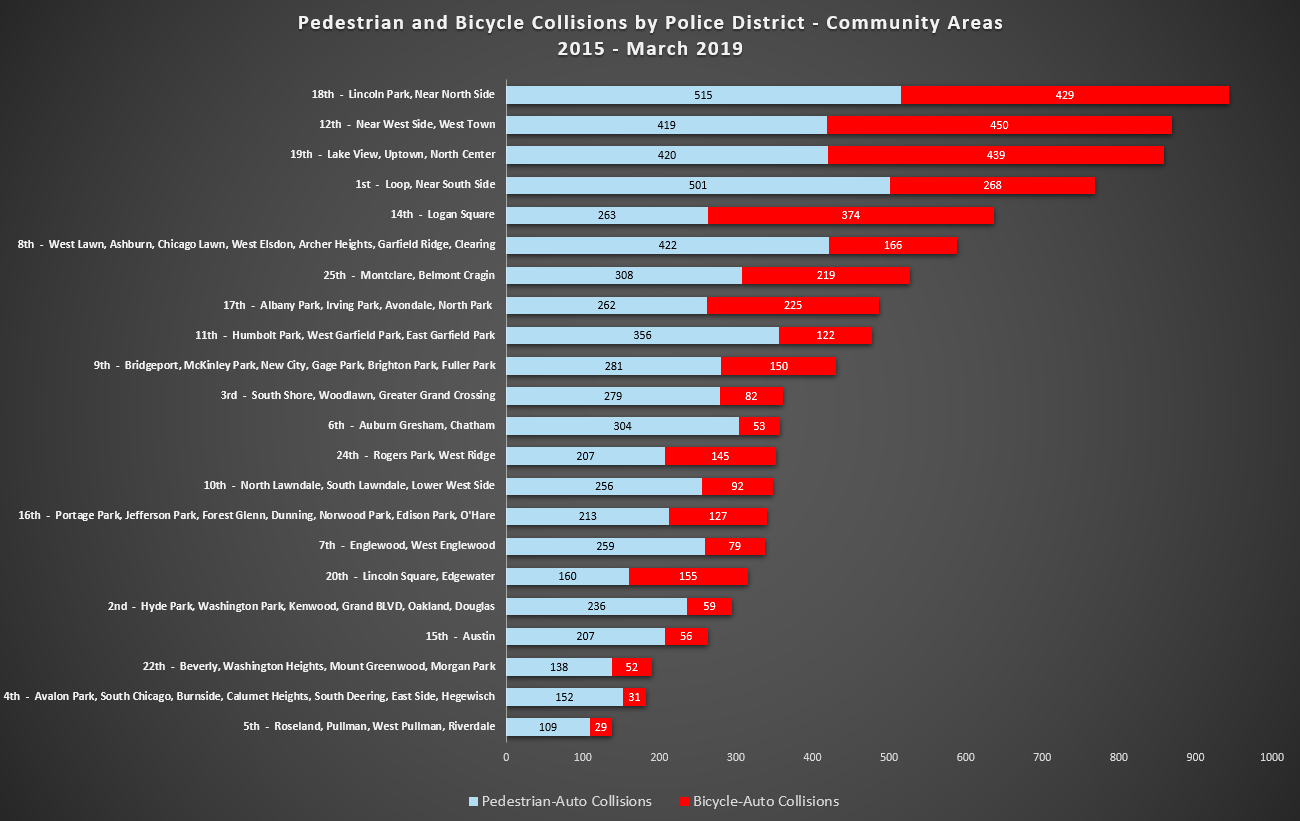
Walkers and bikers alike both experience more injuries than vehicle drivers and passengers when involved in accidents, but the differences in injury rates are dramatic. Predictably, pedestrians get the worst of it with 90.5% of collisions resulting in injury. Bicyclists fair a bit better, with 64.5% of their collisions resulting in injury. Compare these rates to accidents involving neither pedestrians or cyclists - these scenarios see injuries at only an 8.86% clip.
So what causes traffic accidents?
There are an endless number of causes6 for car crashes, but almost all of them can be boiled down to human error. Whether it’s distracted driving, drunk driving, or running a stop sign, nearly all car crashes are considered preventable. However, while you yourself may be the model driver, there’s no accounting for what others on the road might do.
One data view our team was particularly interested in was which immediate causes are behind the most car crashes in Chicago. The “Primary Causes” data showed that 37% of crashes had an undetermined (or unreported) cause. For the purposes of this analysis, we set those aside and looked at accidents that were deemed explainable. Of those, the most commonly reported cause was "following too closely" with "failure to yield the right-of-way" coming in a close second. These causes led the rest by a fairly large margin, underscoring the role of driver responsibility in accident prevention.
Every situation from a parking lot shuffle to a power outage at a six-way stop light has a clear and defined right-of-way. It’s our job as licensed drivers to know this right-of-way and follow it. Since we can’t always communicate from car to car, behaving in a predictable manner is essential for road safety.
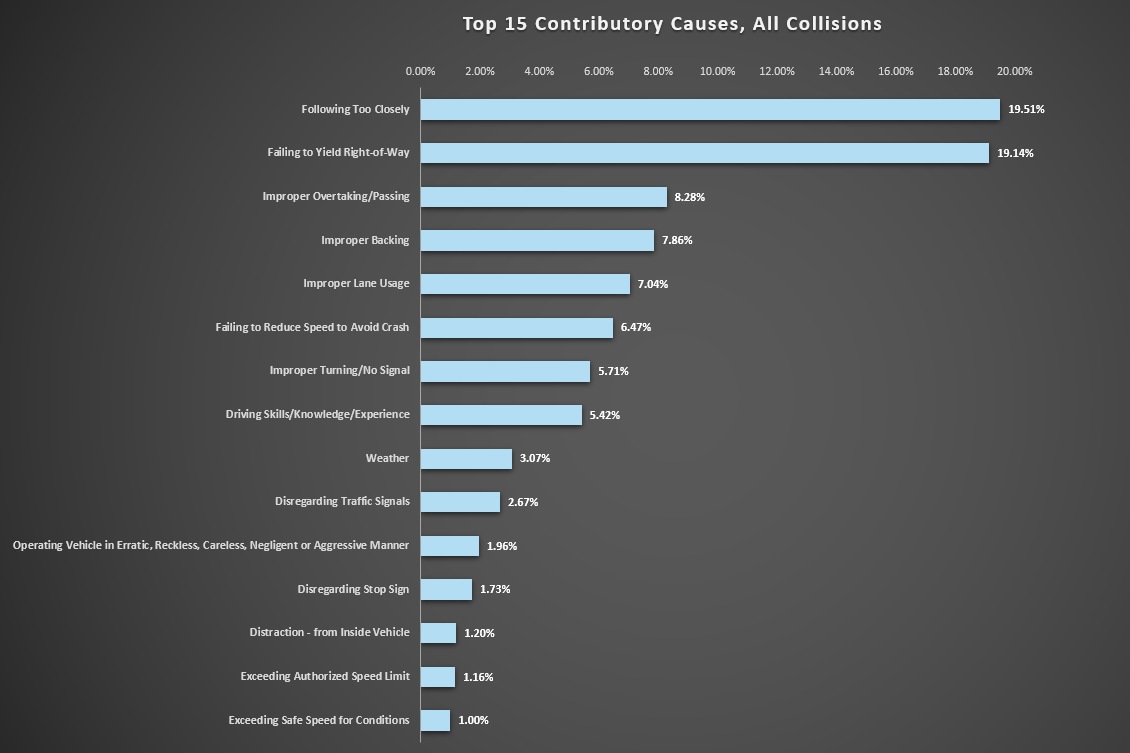
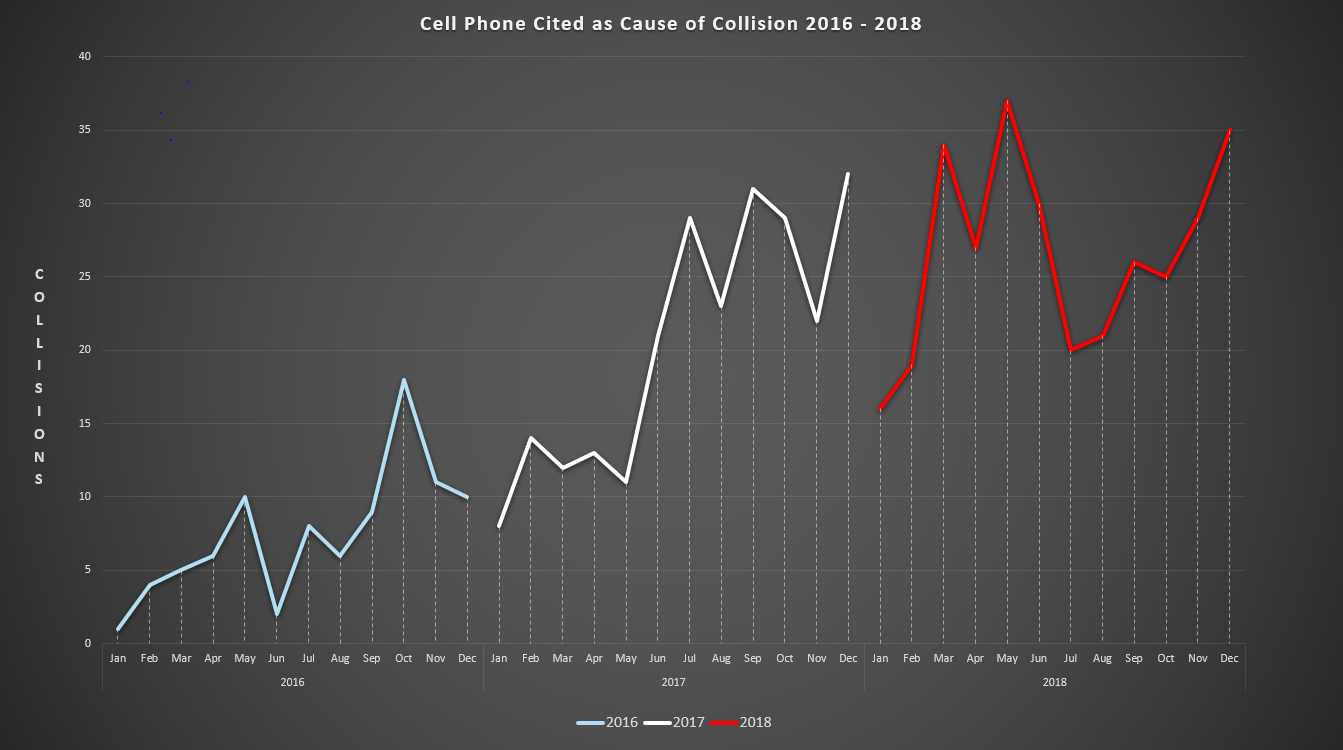
Although this data lists “Distraction from Inside the Car” relatively low on the list, it’s possible that drivers distracted by their cell phones can account for at least some portion of the 37% of accidents with no reported cause. It’s no secret that many people can’t seem to put their phone down, even while driving. But distracted drivers may not be so eager to disclose that information at the scene of an accident. Even with the data available, it’s clear that distracted driving is on the rise.
When do most crashes occur?
Just like the high tides and low tides of the ocean, Chicago has peaks and valleys in traffic that you can almost set your watch by. Perhaps unsurprisingly, these rush hours (when the majority of Chicago’s office workers are commuting) also show a rise in collisions. The more cars there are on the roads, the more likely some of them are to collide.
However, the data shows that the evening rush hour is more dangerous than the morning rush hour. This is likely due to the fact that more non-commuting vehicles are on the roads in the evening in addition to all the commuters. Furthermore, commuters may be fatigued from a long day of work and more eager to get home in the evening.
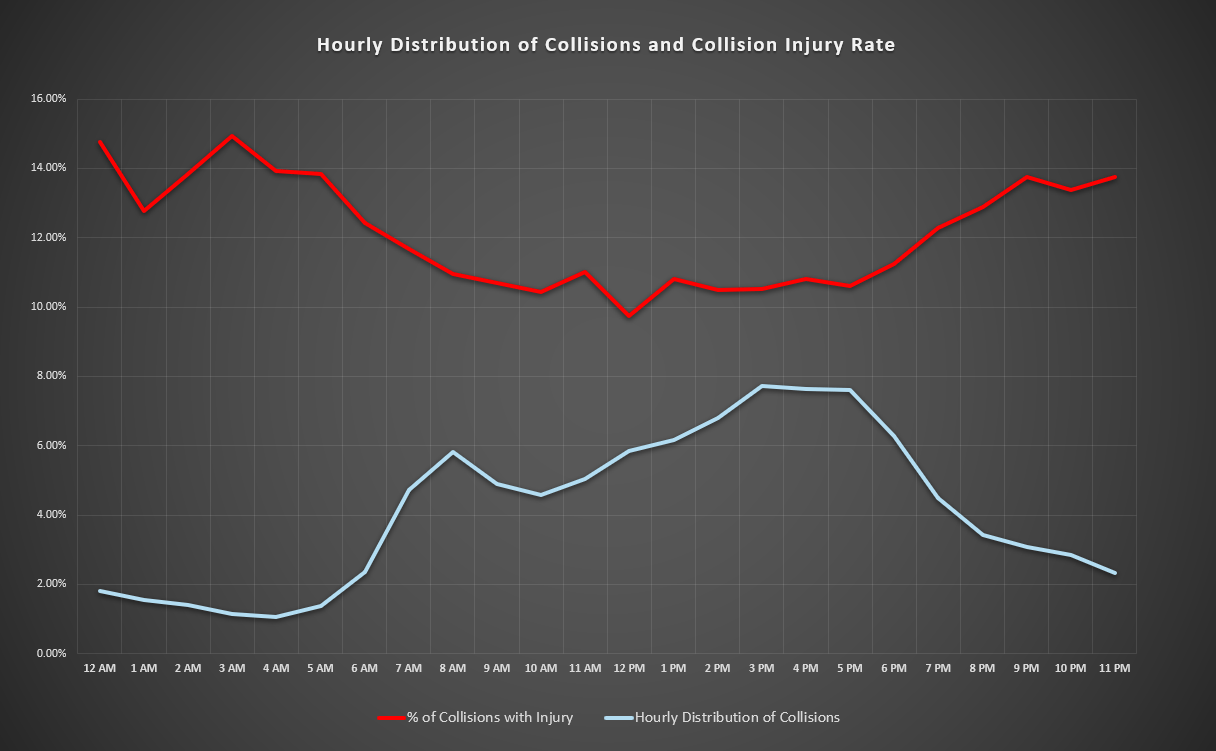
An interesting aspect to note is that while collisions peak at rush hours and during the day, collisions that result in injuries show an almost opposite trend, peaking late at night and in the early hours of the morning. It’s possible that while fewer vehicles are on the road, the present vehicles are able to drive faster and more recklessly. These are also the hours of the day when most drunk driving incidents occur.7
Arrests After Collisions Caused by Drugs or Alcohol, by District
In regard to drunk driving, one interesting dataset to examine is how many arrest were made, by police district, out of all of the collisions where drugs or alcohol were reported as the primary cause. Should whether someone is arrested for intoxicated driving after being in a collision depend on the police district where they crashed? In a society which values equality under the law, most would likely say no. Negligence, shown by toxicity levels, should be the determining factor. But does the Chicago Police Department data agree?
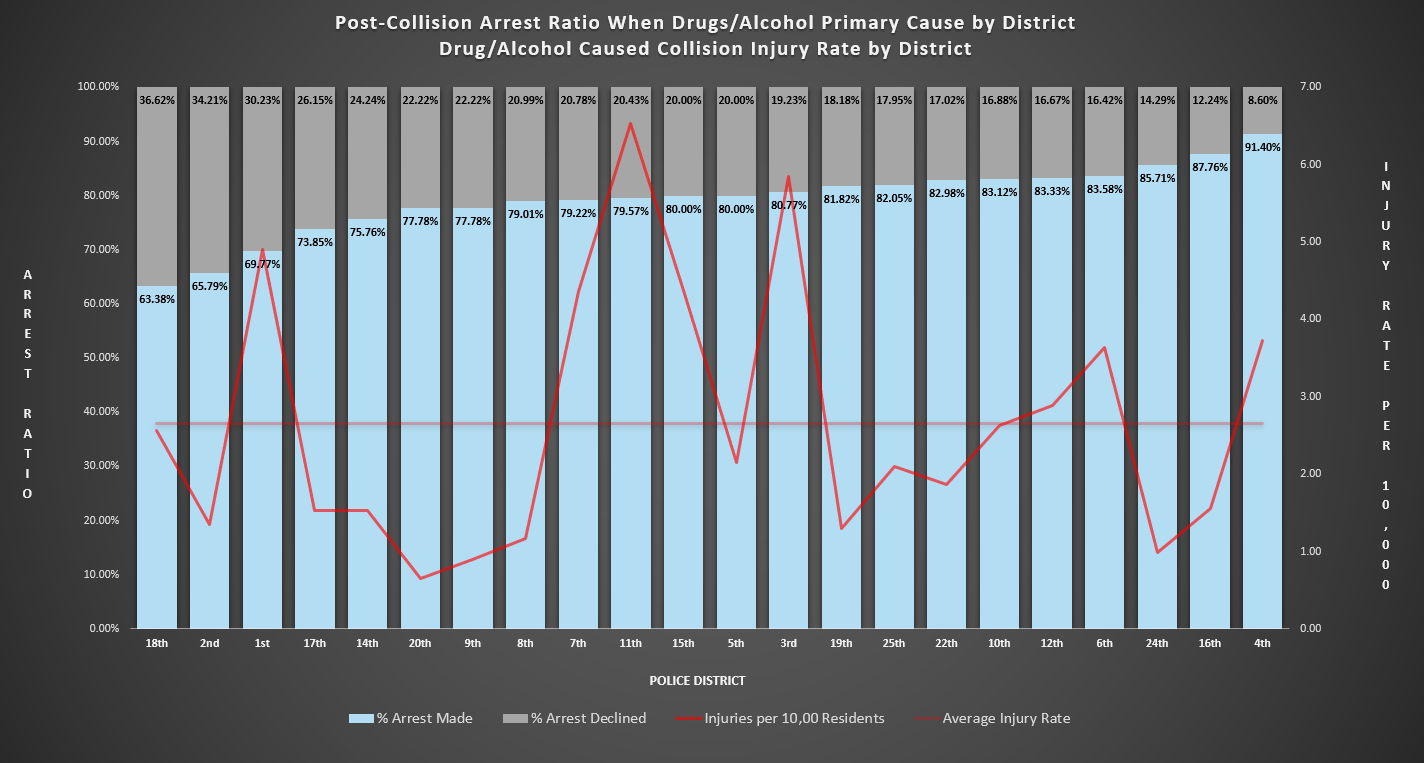
Based on police district, the rate of arrest in drug or alcohol related collisions can vary from district to district by almost thirty percent. It's possible that different districts more routinely see different levels of drug/alcohol induced impairment. For example, areas with a higher concentration of bars might see more drunk drivers with higher blood alcohol rates than other areas. But if the differences in arrest rates corresponded to higher levels of intoxication/impairment, then couldn't we expect to see higher injury rates from intoxication-caused collisions in districts with higher arrest rates? That's not what the data suggests.
The jagged red line represents the per capita injury rate for each district resulting from collisions in which the primary cause was drugs or alcohol. Reference the table near the top of this page to see which districts include which neighborhoods. The interesting thing about the red line is it appears uncorrelated to the arrest rate, the Pearson correlation coefficient8 only 0.04. This could indicate that level of driver toxicity, which we would expect to be correlated with the injury rate, is not a major factor determining the arrest rate.
It's often repeated when discussing statistics that correlation does not prove causality. This is true, but it is also true that without correlation there is no causality possible. It would appear at least possible that traffic related public safety concerns are not driving differential arrest rates across districts, though this cannot be definitively concluded by our simple exploratory analysis.
The number of total injuries per district is not an informative measure by itself in comparing districts, as it would be expected that there would be more injuries in more trafficked districts. We didn't have a measure of traffic flow per district, so we used population as a proxy. District population data came from the Chicago Police Department.9 So not only is this data a proxy, but the last census from which it came is now almost 10 years old.
Other factors could also explain the apparent district bias. The data doesn't indicate exactly why arrests were made, only that they were. There could be scenarios in which, although the driver was not over the legal limit, they were arrested for other violations discovered on the scene.
While there are a lot of potentially significant variables unaccounted for in the data, on the surface level we can see that some police districts are quicker to reach for the handcuffs than others. A deeper investigation including more granular data might be able to determine with some estimate of certainty whether a district bias really exists, what might be driving it, and provide insight into how to implement city resources toward lowering the damage and injuries caused by intoxicated drivers.
Thanks for reading, and drive safe!
Our interactive map was built using Map Box.10 We’d like to thank the City of Chicago for making this data publicly available. We took inspiration from Todd Schneider’s analysis of New York City traffic data.11 We hope you had as much fun reading our findings as we did analyzing the data. For anyone interested in the raw data we used for graphs and analysis, we have made that available in our bibliography below.12 As always, drive safe out there!